TEXSTAN
Institut für Thermodynamik der
Luft- und Raumfahrt - Universität Stuttgart
Mechanical Engineering
- The University of Texas at Austin
- home |
- overview |
- modeling |
- boundary layer |
- pipe flow |
- turbine blade
output files
The out.txt file contains the primary results of the integration, and the print interval is controlled by the kspace variable. Note the first print location for internal flows is always at integration step 5 (intg=5) rather than at x=xstart (which would be intg=0) and the last print location is at x=xend. Intermediate output occurs at integration steps that are multiples of kspace.
The ftn.txt files are created whenever the input data flag k5 is set >0, and they are formatted for easy use with plotting packages. These files include:
- ftn82.txt - Nusselt Number at E-Surface
- ftn84.txt - Surface Heat Flux at E-Surface
- ftn85.txt - Friction at I-Surface and E-Surfaces
For full parallel planes (kgeom=6) and the annulus (kgeom=7) there are two additional files written for I-surface information: ftn81.txt corresponds to the ftn82.txt, and the ftn83.txt corresponds to the ftn84.txt. These files are not reprinted here.
The ftn74.txt file contains profiles of the dependent variables, printed using three options:
- ftn74.txt - Standard Profiles - at all x(m) locations when k10=11
- ftn74.txt - Benchmark Profiles - pipe - at all x(m) locations when k10=10
- ftn74.txt - Single Set of Profiles - at a specified location using the k10 variable
out.txt - Standard Output when kout=4 - This file can be used with all kgeom internal flows.

where the following TEXSTAN variables translate into textbook variables

out.txt - Benchmark Output when kout=8 - This file has been designed for used only with select datasets of the kgeom=4,5 class of internal flow.

where the following TEXSTAN variables translate into textbook variables

ftn82.txt - Nusselt Number at E-Surface - This file prints the Nusselt number distribution when heat transfer is being calculated.

where the following TEXSTAN variables translate into textbook variables

ftn84.txt - Surface Heat Flux at E-Surface - This file prints the surface heat flux distribution when heat transfer is being calculated.

where the following TEXSTAN variables translate into textbook variables

ftn85.txt - Friction at I-Surface and E-Surfaces - This file prints friction distributions for the I- and E-surfaces all internal flows. Note - if the I-surface is a symmetry line (kgeom=4,5) the values will be zero.

where the following TEXSTAN variables translate into textbook variables

ftn74.txt - Standard Profiles - at all x(m) locations when k10=11 - This first option prints profiles at xstart and at xend and at all x(m) locations between xstart and xend. The kspace variable is ignored. The user can further control where profiles are printed by adding additional x(m) locations and their corresponding boundary conditions. For example, in s30.dat.txt the variable nxbc=5 and there are 5 x(m) locations, although technically only two boundary condition locations are needed for a dataset that has a constant surface temperature or heat flux boundary condition.

The wall radius is defined by rw(m). The aux1(m) array is non-zero because s30.dat.txt is a combined entry flow problem, and it is important to set kdx=1, deltax=0.0, and instead input deltax by way of the aux1(m) array, as discussed in the
internal flows: integration control section.
Here is a sample of the profile information in file ftn74.txt, and printed for x(m=5)=xend.

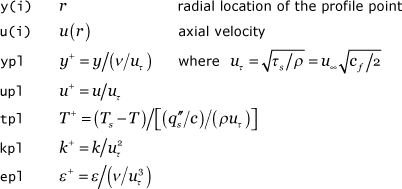
where the following TEXSTAN variables translate into textbook variables

ftn74.txt - Benchmark Profiles - pipe - at all x(m) locations when k10=10 - This second option for printing profiles is similar to the first option, but it has been designed for use only with select pipe flow datasets (kgeom=4). The profiles have been normalized using variables that are consistent with whether the benchmark test case is laminar flow or turbulent flow.
laminar flow

where the following TEXSTAN variables translate into textbook variables

turbulent flow

where the following TEXSTAN variables translate into textbook variables

ftn74.txt - Single Set of Profiles - at a specified location using the k10 variable - This third option for printing profiles is to set k10 =24 to cause profiles of all the dependent variables to be printed at a single location when the nondimensional parameter x/Dh equals (or exceeds) a value defined by the input variable bxx. This set of profiles is written to files ftn73.txt and ftn74.txt. The files are mostly identical, but the file ftn73.txt is formatted in a special way for use with kstart=0 to restart TEXSTAN, and this format is discussed in the internal flows: initial profiles part of this section. For plotting and analysis purposes, the file ftn74.txt is more meaningful. The output structure of this profile is identical to that described above for k10=11 and not reprinted here.
website updated Sept 2010 © 1996-2010 Michael E. Crawford - all rights reserved - website validated for CSS 2.1 and XHTML 1.0 strict at www.w3.org
